深度学习|求导公式:梯度逆传播规律

引言
我们知道,神经网络的能够学习处理任务的核心是计算损失的梯度,而误差逆传播算法是求梯度的一种通用且高效的办法。使用误差逆传播算法求解神经网络的梯度,其实就是求网络中使用的各种基本运算的局部导数的过程。这期我们将回顾各类基本运算的求导公式,然后演示如何将这些公式运用在误差逆传播算法求解网络梯度。
依赖模块统一导入
此处我们统一导入本文所需的所有依赖模块,下文中不再重复演示。
import numpy as np
import matplotlib.pyplot as plt
作图准备
此处我们准备一个可以绘制下文所有函数图形的
draw方法,并准备作图用的数据,方便后续演示。def draw(X, func, func_derivative, title, x_point=1, color='orange', **kwargs):
"""
绘制函数、切线、导数函数的图形
:param X: 输入数据
:param func: 函数
:param func_derivative: 函数导数
:param title: 图形标题
:param x_point: 切线点的 x 轴坐标
:param color: 图形颜色
:param kwargs: 函数的参数
"""
# 创建子图,figsize 参数指定图形的大小为 12 x 5
fig, axs = plt.subplots(1, 2, figsize=(12, 4.5))
# 绘制函数图形
axs[0].plot(X, func(**kwargs)(X), label=title, color=color)
axs[0].set_title(title)
axs[0].set_xlabel('Input')
axs[0].set_ylabel('Output')
# 绘制在 x_point 处的切线
func_x_point = func(**kwargs)(x_point)
func_prime = func_derivative(**kwargs)(x_point)
tangent_line_func = func_x_point + func_prime * (x - x_point)
axs[0].plot(x, tangent_line_func,
label=f"Tangent to {title} at x={x_point}", linestyle=':', color='red')
axs[0].scatter([x_point], [func_x_point], color='red')
# legend 函数用于显示图例
axs[0].legend()
# grid 函数用于显示网格
axs[0].grid(True)
# 绘制导数函数图形
axs[1].plot(X, func_derivative(**kwargs)(X), label=f"Derivative of {title}", color=color)
axs[1].set_title(f"Derivative of {title}")
axs[1].set_xlabel('Input')
axs[1].set_ylabel('Output')
axs[1].legend()
axs[1].grid(True)
# tight_layout 函数用于调整子图之间的间距
plt.tight_layout()
plt.show()数据准备
# x 从 -2 到 2,等间隔的 400 个点,用于绘制函数图形
x = np.linspace(-2, 2, 400)
基础函数的求导
常数函数
常数函数是指函数的值在定义域内保持为常数 ,即:
常数函数的导数为零:
使用 Python 实现常数函数及其导数:
def constant_function(c):
    return lambda x: np.full_like(x, c)


def constant_derivative(c):
    return lambda x: np.zeros_like(x)
查看常数函数及其导数的图形:
# 绘制常数 c=1 时,常数函数的图形、常数函数在 x=1.0 处的切线、常数函数的导数图形
draw(x, constant_function, constant_derivative, "Constant Function(c=1)", x_point=1.0, color='blue', c=1)
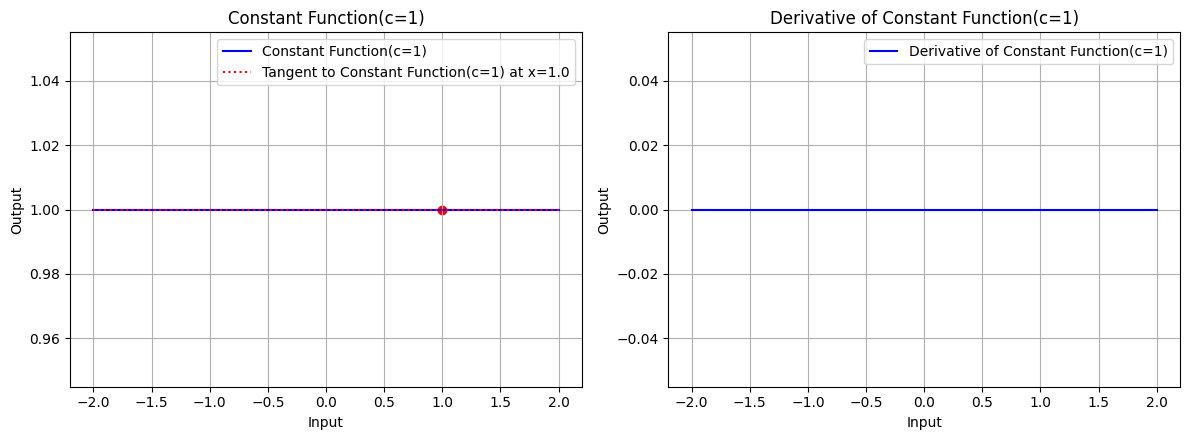
图 1:常数 c=1 时,常数函数的图形、常数函数在 x=1.0 处的切线、常数函数的导数图形
常数函数的图形是一条截距为 的水平直线,其导数为零,导数函数的图形是一条全为零的水平直线。
幂函数
幂函数是指函数的定义域为实数,求关于 的 次幂的函数,其中 是整数,即:
幂函数 的导数为:
使用 Python 实现幂函数及其导数:
def power_function(n):
    return lambda x: np.power(x, n)


def power_derivative(n):
    return lambda x: n * np.power(x, n - 1)
查看幂函数及其导数的图形:
# 绘制指数 n=2 时,幂函数的图形、幂函数在 x=1.0 处的切线、幂函数的导数图形
draw(x, power_function, power_derivative, "Power Function(n=2)", x_point=1.0, color='blue', n=2)
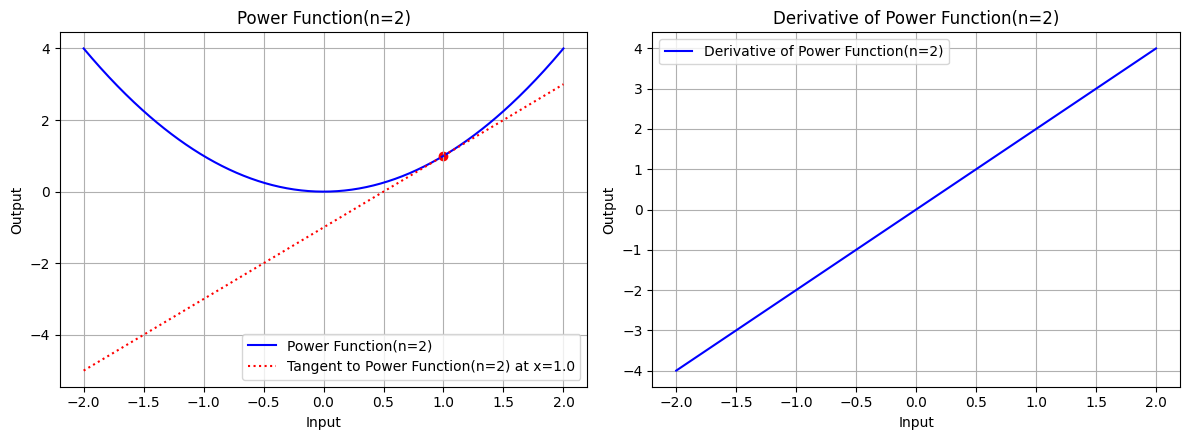
图 2.1:指数 n=2 时,幂函数的图形、幂函数在 x=1.0 处的切线、幂函数的导数图形
# 绘制指数 n=3 时,幂函数的图形、幂函数在 x=1.0 处的切线、幂函数的导数图形
draw(x, power_function, power_derivative, "Power Function(n=3)", x_point=1.0, color='blue', n=3)
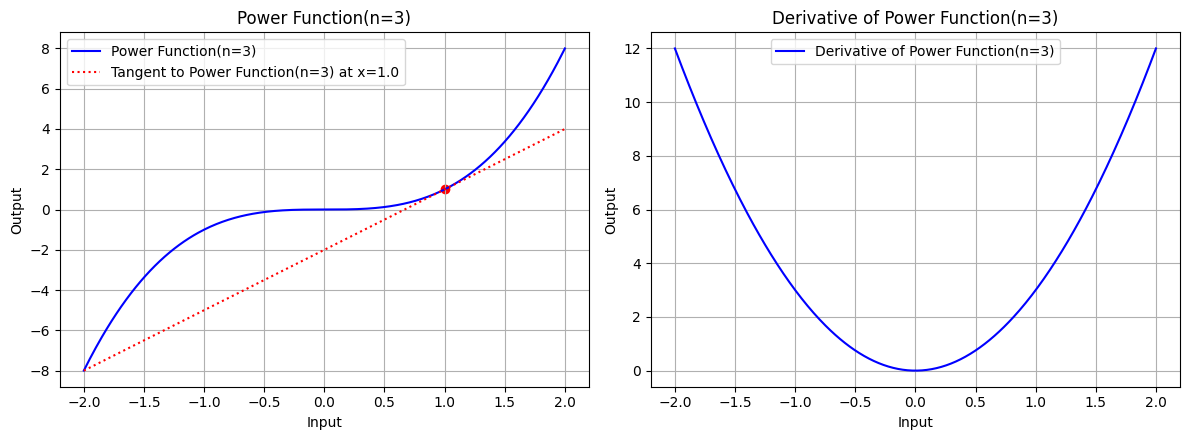
图 2.2:指数 n=3 时,幂函数的图形�、幂函数在 x=1.0 处的切线、幂函数的导数图形
幂函数的图形是一条经过原点的曲线,其导数为 ,导数函数的图形是一条经过原点的曲线。
指数函数
指数函数是指函数的定义域为实数,求实数 的 次幂的函数,即:
指数函数的导数为:
当 时,这个函数被称为自然指数函数:
自然指数函数的导数为:
使用 Python 实现指数函数及其导数:
def exp_function(a):
    return lambda x: np.exp(x) if a == np.e else np.power(a, x)


def exp_derivative(a):
    return lambda x: np.exp(x) if a == np.e else np.power(a, x) * np.log(a)
查看指数函数及其导数的图形:
# 绘制底数 a=e 时,指数函数的图形、指数函数在 x=1.0 处的切线、指数函数的导数图形
draw(x, exp_function, exp_derivative, "Exp Function(a=e)", x_point=1.0, color='blue', a=np.e)
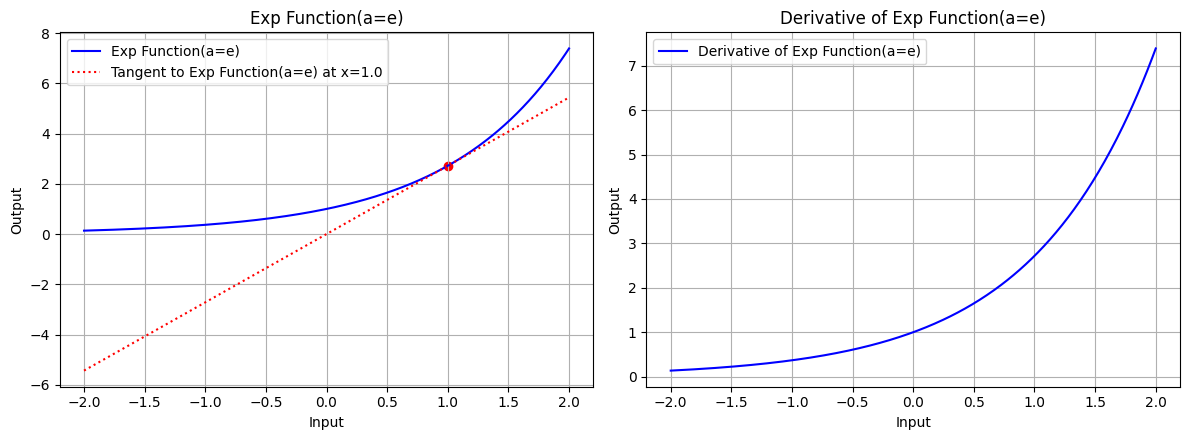
图 3.1:底数 a=e 时,指数函数的图形、指数函数在 x=1.0 处的切线、指数函数的导数图形
draw(x, exp_function, exp_derivative, "Exp Function(a=10)", x_point=1.0, color='blue', a=10)
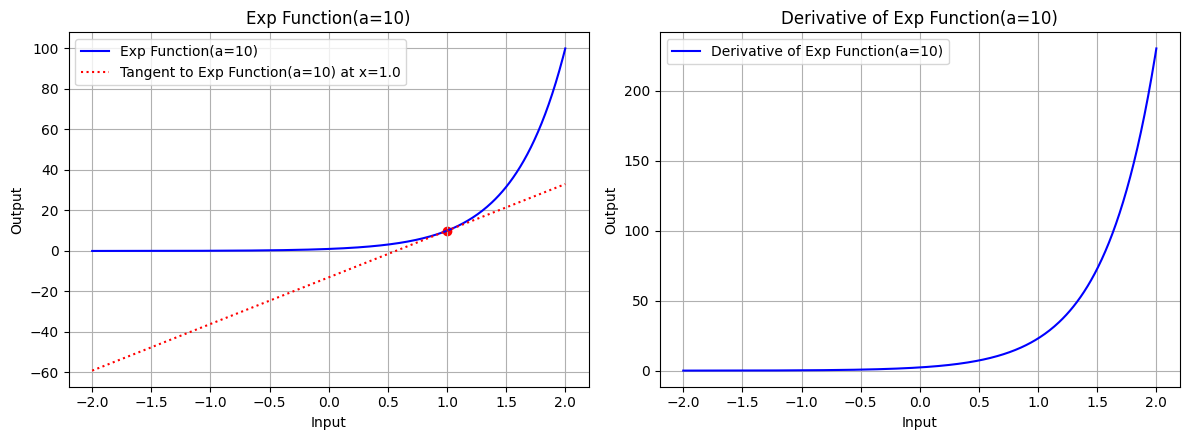
图 3.2:底数 a=10 时,指数函数的图形、指数函数在 x=1.0 处的切线、指数函数的导数图形
对数函数
对数函数是指函数的定义域为正实数,求底数为 的实数 的对数的函数,即:
对数函数的导数为:
当底数 时,我们称这样的对数函数为自然对数函数:
自然对数函数的导数为:
常用对数 的导数:
使用 Python 实现对数函数及其导数:
def log_function(base):
    return lambda x: np.log(x) / np.log(base)


def log_derivative(base):
    return lambda x: 1 / (x * np.log(base))
查看对数函数及其导数的图形:
x_log = np.linspace(0.01, 3, 400)
draw(x_log, log_function, log_derivative, "Log Function(base=e)", x_point=1.0, color='blue', base=np.e)
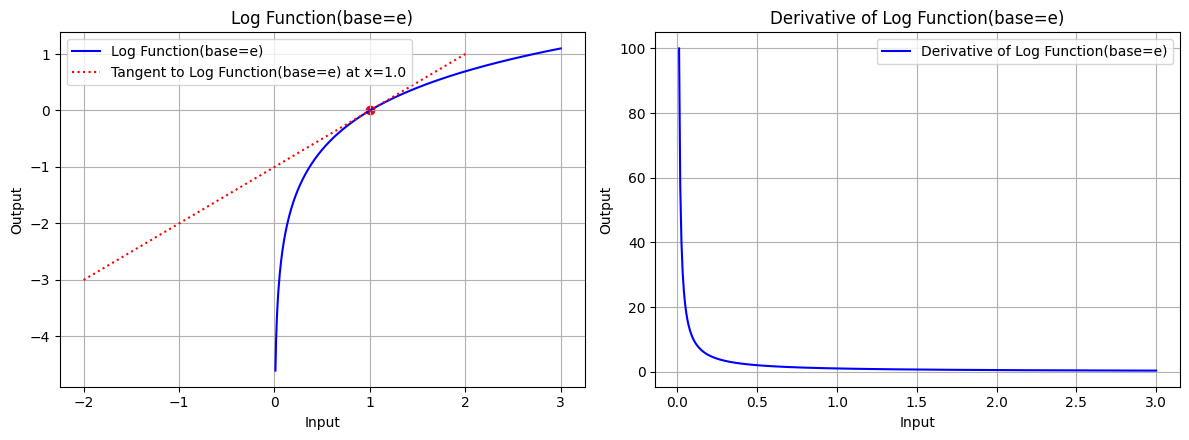
图 4.1:底数 base=e 时,对数函数的图形、对数函数在 x=1.0 处的切线、对数函数的导数图形
draw(x_log, log_function, log_derivative, "Log Function(base=10)", x_point=1.0, color='blue', base=10)
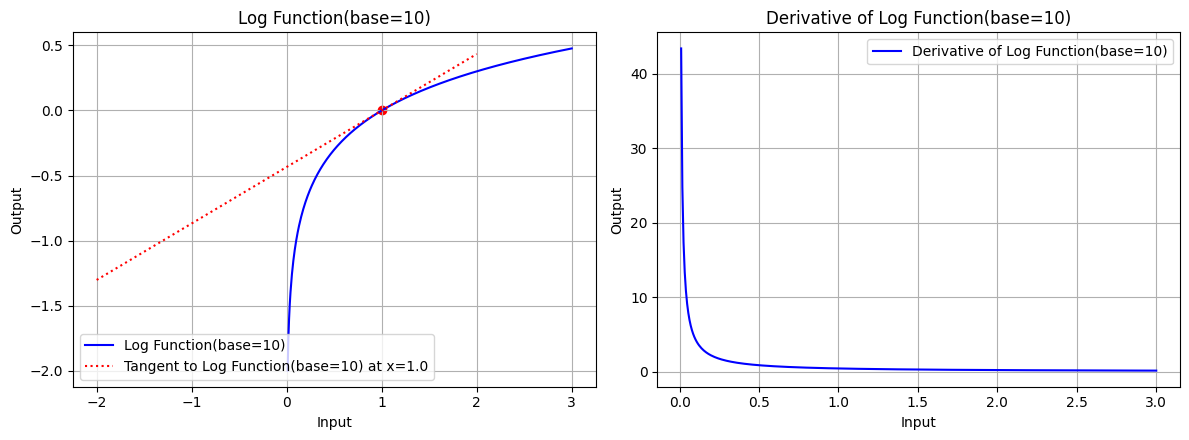
图 4.2:底数 base=10 时,对数函数的图形、对数函数在 x=1.0 处的切线、对数函数的导数图形
三角函数
三角函数是指函数的定义域为实数,求三角形的角度的函数,常见的三角函数包括正弦函数 、余弦函数 和正切函数 。
正弦函数 的导数:
余弦函数 的导数:
正切函数 的导数:
使用 Python 实现三角函数及其导数:
def sin_function():
    return lambda x: np.sin(x)


def sin_derivative():
    return lambda x: np.cos(x)


def cos_function():
    return lambda x: np.cos(x)


def cos_derivative():
    return lambda x: -np.sin(x)


def tan_function():
    return lambda x: np.tan(x)


def tan_derivative():
    return lambda x: 1 / np.cos(x)**2
查看三角函数及其导数的图形:
x_tri = np.linspace(-5, 5, 400)
draw(x_tri, sin_function, sin_derivative, "Sin Function", x_point=1.0, color='blue')
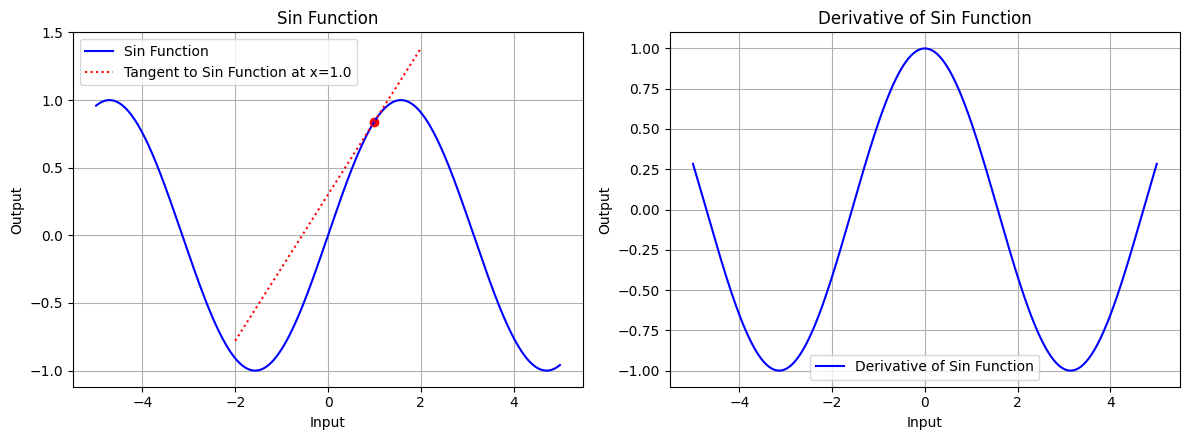
图 5.1:正弦函数的图形、正弦函数在 x=1.0 处的切线、正弦函数的导数图形
draw(x_tri, cos_function, cos_derivative, "Cos Function", x_point=1.0, color='blue')
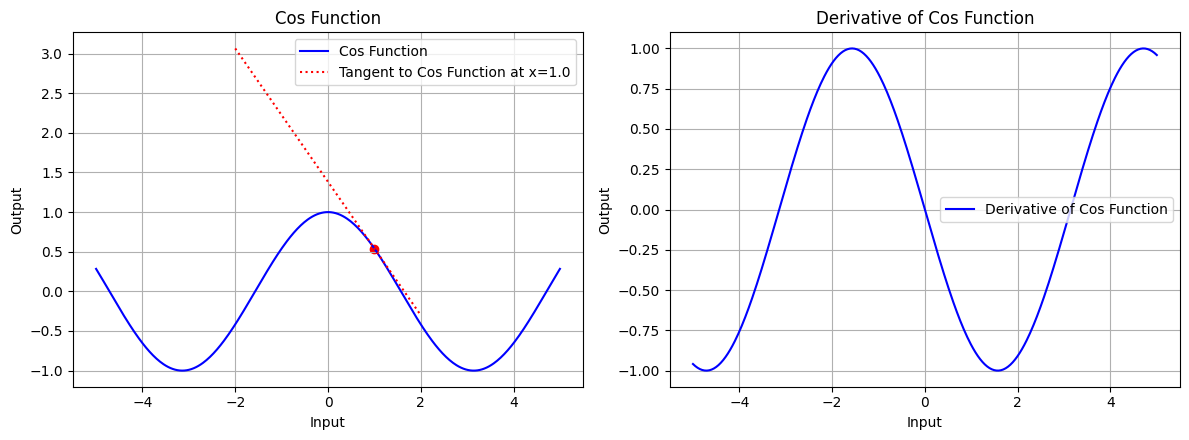
图 5.2:余弦函数的图形、余弦函数在 x=1.0 处的切线、余弦函数的导数图形
x_tri = np.linspace(-1.5, 1.5, 100)
draw(x_tri, tan_function, tan_derivative, "Tan Function", x_point=1.0, color='blue')
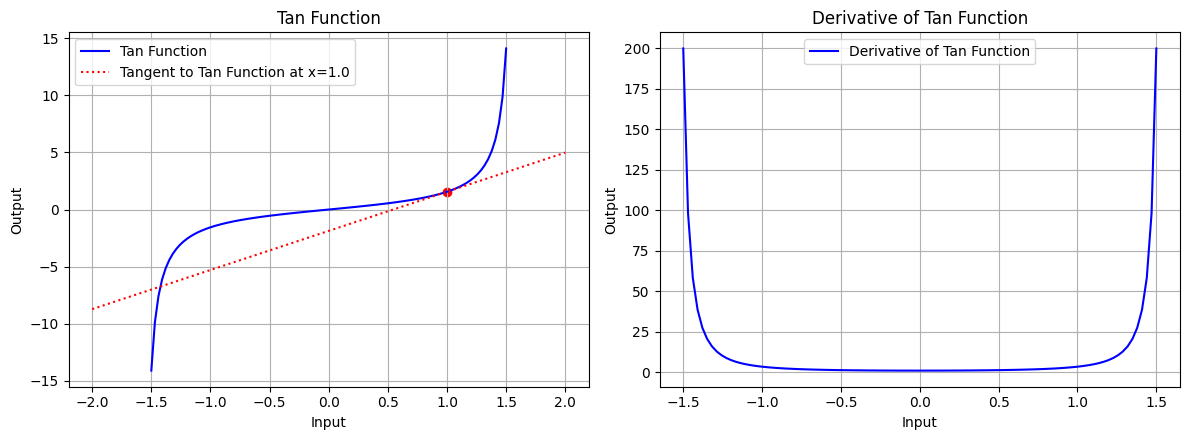
图 5.3:正切函数的图形、正切函数在 x=1.0 处的切线、正切函数的导数图形
反三角函数
反三角函数是指函数的定义域为实数,求三角函数的反函数,常见的反三角函数包括反正弦函数 、反余弦函数 和反正切函数 。
反正弦函数 的导数:
反余弦函数 的导数:
反正切函数 的导数:
使用 Python 实现反三角函数及其导数:
def arcsin_function():
    return lambda x: np.arcsin(x)


def arcsin_derivative():
    return lambda x: 1 / np.sqrt(1 - x**2)


def arccos_function():
    return lambda x: np.arccos(x)


def arccos_derivative():
    return lambda x: -1 / np.sqrt(1 - x**2)


def arctan_function():
    return lambda x: np.arctan(x)


def arctan_derivative():
    return lambda x: 1 / (1 + x**2)
查看反三角函数及其导数的图形:
x_atri = np.linspace(-0.999, 0.999, 100)
draw(x_atri, arcsin_function, arcsin_derivative, "ArcSin Function", x_point=0.25, color='blue')
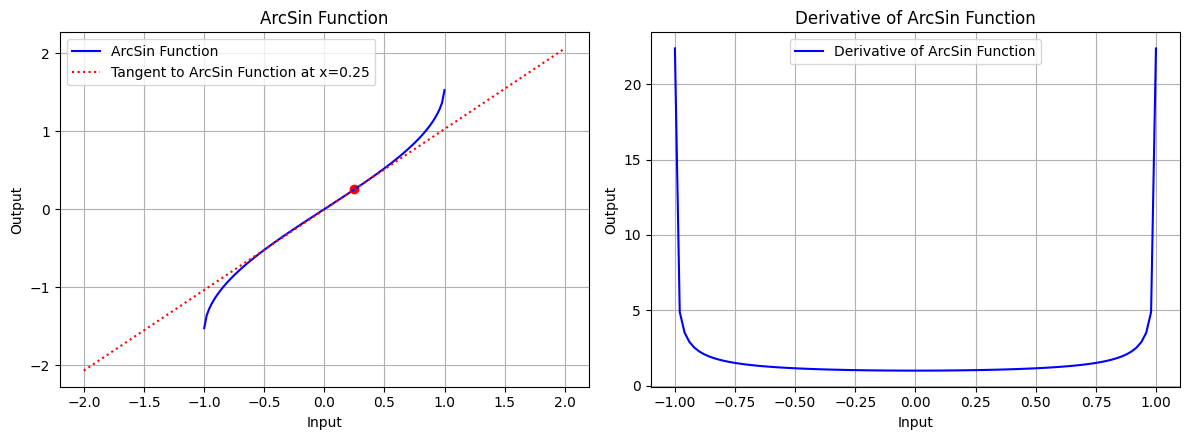
图 6.1:反正弦函数的图形、反正弦函数在 x=0.25 处的切线、反正弦函数的导数图形
draw(x_atri, arccos_function, arccos_derivative, "ArcCos Function", x_point=0.25, color='blue')
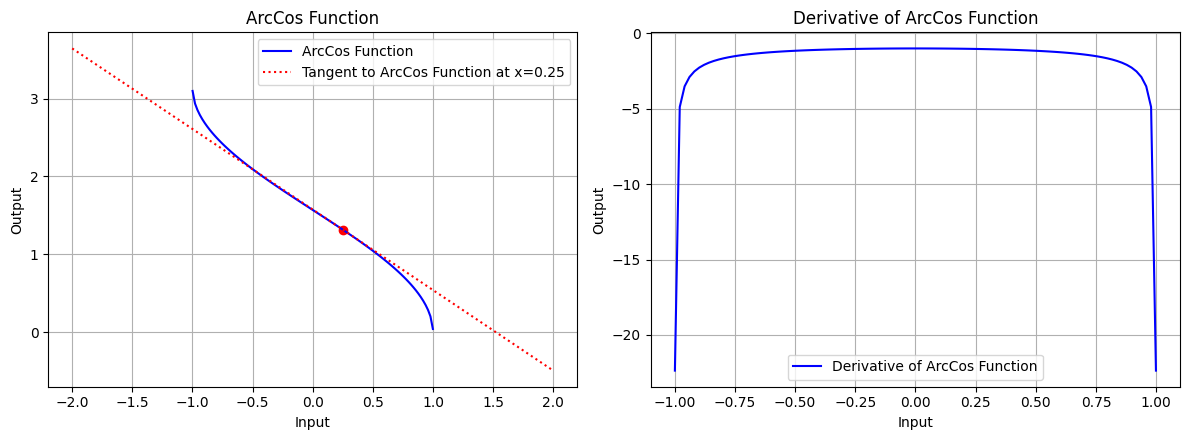
图 6.2:反余弦函数的图形、反余弦函数在 x=0.25 处的切线、反余弦函数的导数图形
x_atri = np.linspace(-5, 5, 100)
draw(x_atri, arctan_function, arctan_derivative, "ArcTan Function", x_point=0.25, color='blue')
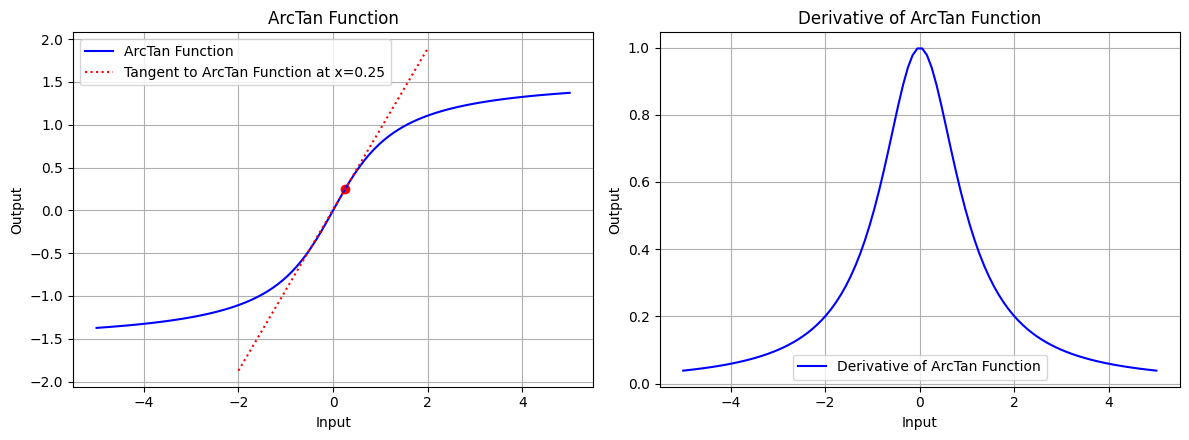
图 6.3:反正切函数的图形、反正切函数在 x=0.25 处的切线、正切弦函数的导数图形
双曲函数
双曲函数是指函数的定义域为实数,求双曲线的性质的函数,常见的双曲函数包括双曲正弦函数 、双曲余弦函数 和双曲正切函数 。
双曲函数是在数学中类似于常见三角函数的一类函数,用于描述双曲线的几何性质。双曲函数按照与三角函数相似的方式,但专注于双曲线的性质,描述许多自然现象。双曲函数在物理和工程中有广泛应用,如描述悬链线问题等。它们与指数函数有密切的关系,同时也满足许多类似于三角函数的恒等式。
双曲正弦函数 的导数:
双曲余弦函数 的导数:
双曲正切函数 的导数:
使用 Python 实现双曲函数及其导数:
def sinh_function():
    return lambda x: np.sinh(x)


def sinh_derivative():
    return lambda x: np.cosh(x)


def cosh_function():
    return lambda x: np.cosh(x)


def cosh_derivative():
    return lambda x: np.sinh(x)


def tanh_function():
    return lambda x: np.tanh(x)


def tanh_derivative():
    return lambda x: 1 / np.cosh(x)**2
查看双曲函数及其导数的图形:
x_trih = np.linspace(-5, 5, 100)
draw(x_atri, sinh_function, sinh_derivative, "SinH Function", x_point=0.25, color='blue')
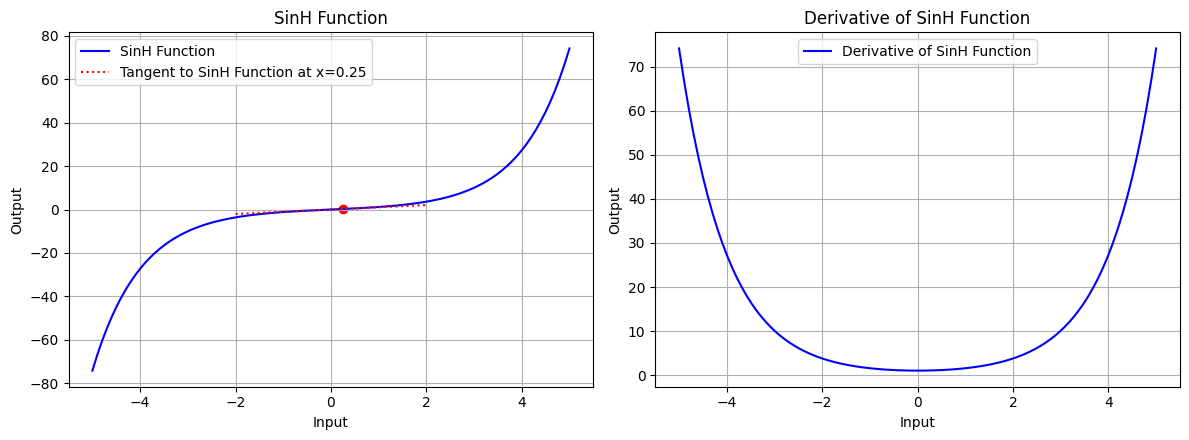
图 7.1:双曲正弦函数的图形、双曲正弦函数在 x=0.25 处的切线、双曲正弦函数的导数图形
draw(x_atri, cosh_function, cosh_derivative, "CosH Function", x_point=0.25, color='blue')
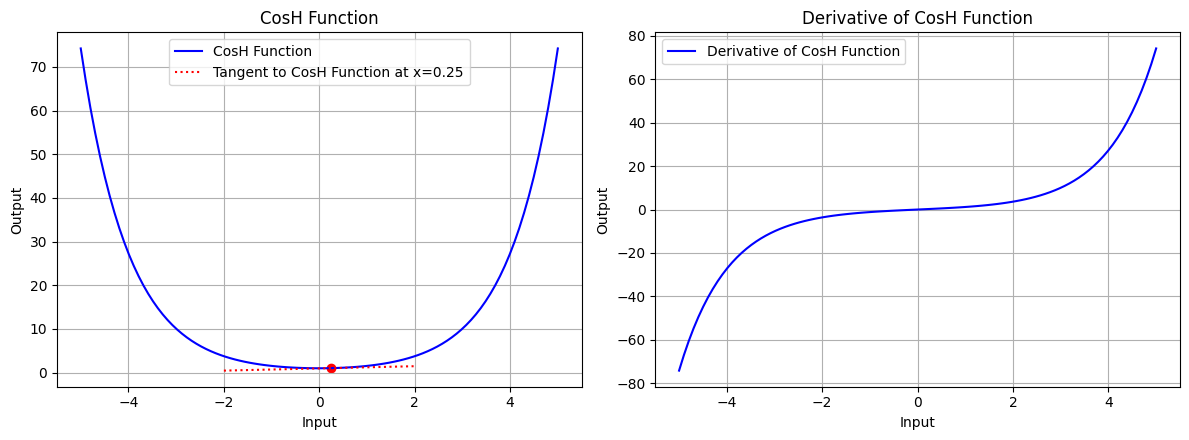
图 7.2:双曲余弦函数的图形、双曲余弦函数在 x=0.25 处的切线、双曲余弦函数的导数图形
draw(x_atri, tanh_function, tanh_derivative, "TanH Function", x_point=0.25, color='blue')
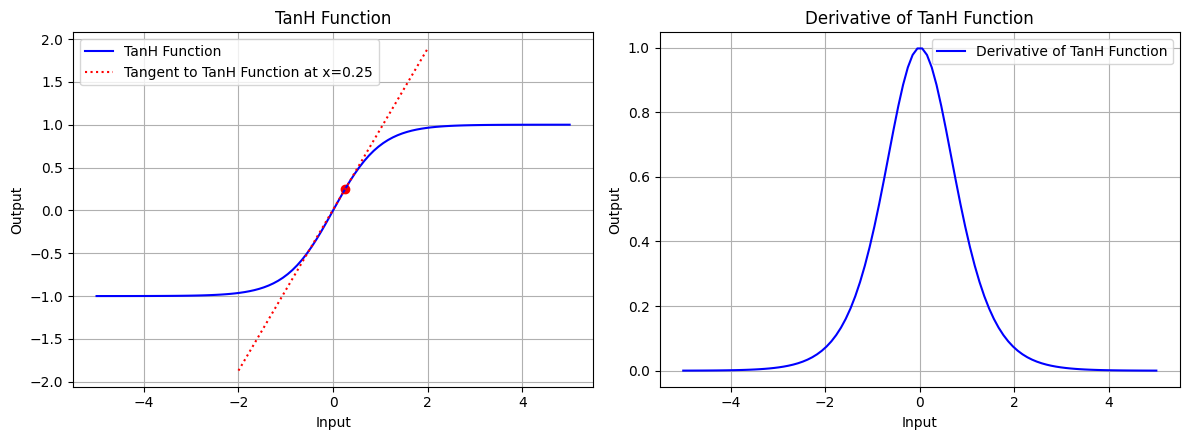
图 7.3:双曲正切函数的图形、双曲正切函数在 x=0.25 处的切线、双曲正切函数的导数图形
复合函数的梯度逆传播
链式法则
链式法则描述的是复合函数的导数计算规则,对于复合函数 ,其导数为:
链式法则是微积分中的一个重要概念,用于计算复合函数的导数。在神经网络中,链式法则被广泛应用于计算损失函数对网络参数的梯度。
函数相加
将两个函数相加得到一个新的函数,即:
函��数相加所得函数的导数为:
若自变量不唯一,如:
此时,函数相加所得函数关于自变量的偏导数分别为:
的计算传播图如下:
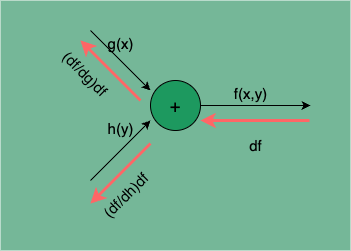
图 8:函数相加的计算传播图
处的梯度为:
处的梯度为:
由此可见,函数相加的梯度逆传播是直接将下游梯度 df 传递给上游,不会发生梯度的变化。
函数相乘
将两个函数相乘得到一个新的函数�,即:
函数相乘所得函数的导数为:
若自变量不唯一,如:
此时,函数相乘所得函数关于自变量的偏导数分别为:
的计算传播图如下:
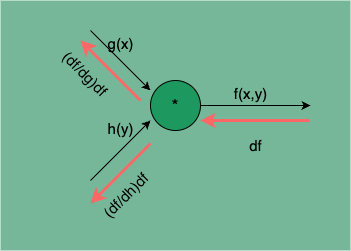
图 9:函数相乘的计算传播图
处的梯度为:
处的梯度为:
由此可见,函数相乘的梯度逆传播,两个函数 g(x)、h(y) 的梯度分是将下游梯度 df 乘以相乘函数 h(y)、g(x)。
函数相除
将两个函数相除得到一个新的函数,即:
函数相除所得函数的导数为:
若自变量不唯一,如:
此时,函数相除所得函数关于自变量的偏导数分别为:
的计算传播图如下:
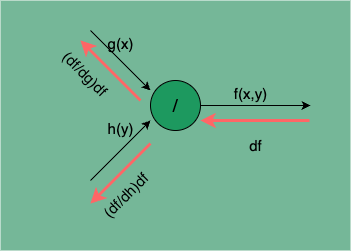
图 10:函数相除的计算传播图
处的梯度为:
处的梯度为:
由此可见,函数相除的梯度逆传播中,被除数 g(x) 的梯度是将下游梯度 df 除以除数 h(y),除数 h(y) 的梯度是将下游梯度 df 乘以被除数 g(x) 再除以除数的平方 。
结语
神经网络学习的核心是计算损失函数的梯度,即求损失函数关于网络参数的偏导数。而网络的计算可以理解成一系列基本运算的复合,因此我们可以通过了解这些基本运算的导数求解方式,以及结合链式法则归纳出这些基本运算的复合形式的求导规律,来完成网络的梯度的高效计算。这就是误差逆传播算法的基本原理。
误差逆传播算法是训练人工神经网络最基本的方法,它通过计算每个神经元的梯度,优化网络的权重以使得输出误差最小化。误差逆传播算法是神经网络的学习核心,是它使得人工神经网络成为一种可行的机器学习模型,可以说没有误差逆传播算法就没有今天人工神经网络的流行。
PS:感谢每一位志同道合者的阅读,欢迎关注、点赞、评论!
